
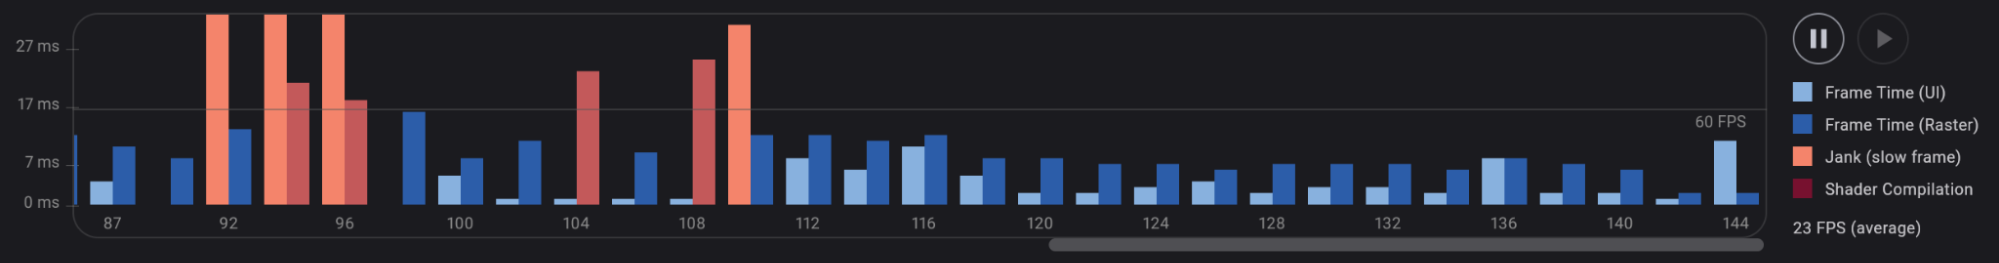
The Flutter frame chart shows a graph of the frame times for your app. Each frame is represented by a vertical bar. The height of the bar represents the amount of time it took to render the frame. The color of the bar indicates the type of frame.
The green bars represent frames that were rendered quickly. The yellow bars represent frames that were rendered slowly. The red bars represent frames that were dropped.
The frame chart can be used to identify performance problems in your app. If you see a lot of yellow or red bars, it means that your app is struggling to render frames. You can use the other tools in the Performance view to identify the cause of the problem.
Here are some tips for reading the Flutter frame chart:
* **Look for patterns.** If you see a pattern of yellow or red bars, it may indicate a problem with your app's performance. For example, if you see a yellow bar every time you scroll through a list, it may mean that your app is struggling to render the list items.
* **Compare frames.** You can compare two frames by selecting them in the chart. This can help you to identify the differences between the frames and track down the cause of a performance problem.
* **Use the other tools in the Performance view.** The Performance view has a number of other tools that can be used to identify performance problems. These tools include the timeline view, the raster stats view, and the advanced debugging tools.
By understanding how to read the Flutter frame chart, you can identify performance problems in your app and improve its performance.